Worksheet For Calculating Carbon Footprint For Rugs as a Small Businesses (Carbon Footprint Calculator Attached for you!)
Sep 17, 2021 | Shashwat Vyas


 As the consumers are demanding businesses to be more responsible and adopt sustainable manufacturing practices, calculating the carbon footprint for the items you produce as a business is becoming really important. We will here show you how to calculate it for a rug and we have also attached an excel spreadsheet for you to be able to calculate the carbon footprint of your products.
 Global Carbon Dioxide emissions from fossil fuel and industries were roughly 36.4 billion metric tons for the year 2019.
Despite a brief dip in the CO2 emissions for the year 2020 the world is still plummeting towards a 3°C rise in global temperature for this century, far beyond the Paris agreement target of 2°C.
As an individual you may feel that the main effort to combat climate change has to be done at a global level, however, did you know that the most common products in your household make up a big chunk of the total emissions?
For example, the fashion industry alone contributes to about 10% of global CO2 emissions.
It is hence becoming increasingly important for businesses to calculate the carbon footprint for the items produced in order to become more sustainable.
Carbon footprint is the total greenhouse gas (GHG) emissions caused by an individual, event, organization, service, place or product, expressed as carbon dioxide equivalent.
The question is how can you calculate the carbon footprint of an item for a life cycle assessment? Here we will show you how to calculate it for a rug as it is a commonly used household item (traditionally called Durrie). This will indicate how you can calculate the carbon footprint of a any items you may produce,
The Life Cycle Assessment (LCA) tool attached below uses the “cradle to grave” methodology to calculate the carbon footprint of a rug.
For this purpose, the rug’s life cycle was divided into Materials & Scrap, Manufacturing, Transportation, Consumer Use and End of Life phases.
Here’s the calculation of the carbon footprint for a rug step by step according to the life cycle stages:
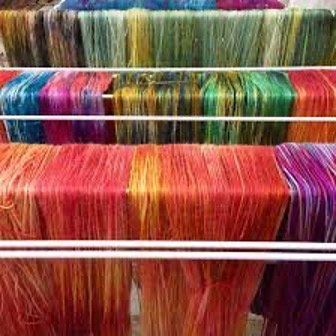
Materials & Scrap Phase: It involves production and extraction of raw materials, including waste
The two raw materials required are yarn, which will be woven into a rug, and reactive dyes for colouring the cloth. Now, for this LCA model, we have considered the yarn to be either cotton, wool or nylon.
The carbon intensities for each type of fibre are given in the table below. This carbon intensity is the CO2 emissions generated from making a kg of the fibre.
The various sources of emissions can be: production of operating materials (eg. crude oil extraction from the ground in case of nylon); energy production and utilisation; water supply use and consumption; crop cultivation (in case of cotton) and spinning the fibres to make yarn.
Additionally, the dyes used to colour the rugs must also have a CO2 cost from the industrial processes involved in their production. The CO2 cost of colouring each kg of yarn is 0.0264 kg CO2e.
2. Manufacturing Phase: Manufacturing processes that occur, which may include molding, cutting, stitching and product assembly
The two main processes in this stage are dyeing and weaving the yarn. Manually the yarn is soaked in tubs and left submerged in it for the dye to set.
The dyed yarn is dried in the sun, untangled and stretched on a charkha. Then, the threads in the desired colour combination, are wrapped around a large octagonal frame.
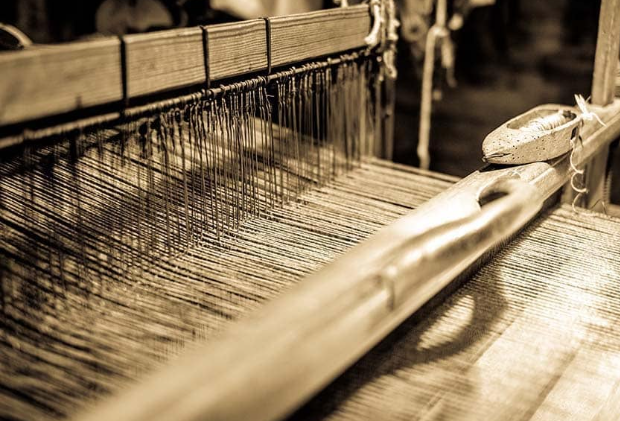
This warp is then wound on the loom. Most traditional craftspersons use a handloom for the weaving process and a comparison has been drawn against a power loom woven rug.
A typical power loom consuming 0.7 kWh per kg thread woven will result in 1.24 kg CO2 equivalent emissions.
During this whole manufacturing process there are some factory overheads involved. The energy consumption from the use of lighting devices and fans also has a carbon footprint and must be considered for the LCA model.
Here, a differentiation must be made in the overheads for handlooms and power looms.
In the former, weaving is done mostly in the open daylight with little requirement for lighting and no use of fans. Assuming that a 10W CFL is used and that it takes 20 days to weave the product, we arrive at 40 hr use of the 10W CFL.
For the latter, the process is much shorter as it is only for a couple of hours. However, since the process takes place in a factory shed, we are assuming three 10W CFLs and two 70W fans being used.
The CO2 emissions from overheads are summarised in the below table:
Transportation Phase: It comprises raw material transportation, product transportation and distribution thereof
Assuming that the cotton is procured from Saurashtra (one of the largest cotton producing district in India) the Transport phase can be further divided into the following stages:
Field to Cotton Mill [F2CM] - within Saurashtra
Cotton Mill to Wholesale Market [CM2W] - Saurashtra to Delhi
Wholesale Market to Craftsmen [WM2C] - Delhi to Agra
Craftsmen to Seaport [C2S] - Agra to Mumbai
Seaport to Warehouse [S2W] - Mumbai to London/New York/Los Angeles
Warehouse to Customers [W2C] - Common dist. for all locations
Below you can see the distance (in kilometers) between each stage:
Consumer Use: Customer care, including washing and drying product over lifetime
For a rug this includes washing and drying of the product. The following data of a commonly used washing-machine has been used:
Considering the life of a machine-made rug as 30 months and that of a handmade rug as 10 years, we then calculate the number of wash-cycles the product undergoes during its life to get the respective figures for CO2 impact from the Consumer Use phase.
5. End of Life: Final disposal of products after use
Furthermore, the model compares the CO2 emissions from handmade and machine-made rugs, along with rugs made from different fabrics like- cotton, wool, nylon and polyester.
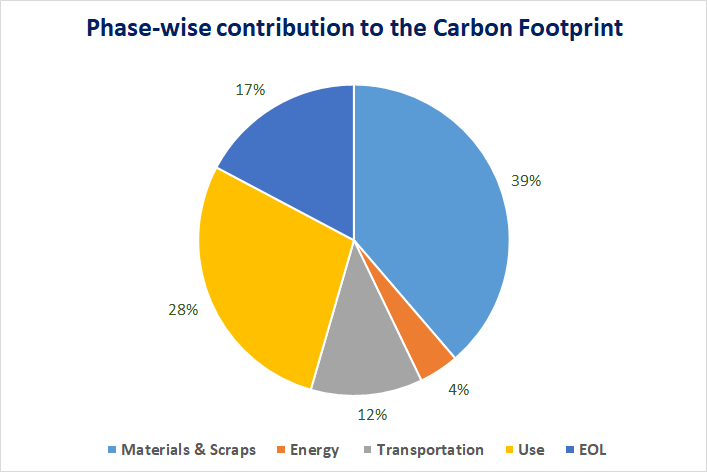
This clearly illustrates that the carbon impact of a handmade rug is mostly driven by the Materials & Scrap and the Consumer Usage phase contributing 39% and 28% respectively.
Another important deduction from the model is the CO2 impact over the years of product use, which brings out a simple way of reducing the overall carbon footprint by increasing the product life.
It is safe to say that on average, a machine-made rug is used for about 36 months. In contrast,a handmade rug would be used for roughly 15 years or even more than that.
This is due to the delicacy and beauty of handicrafts, which adds an emotional value to it, thus ensuring that customers use the products for a longer period of time.
Even when the buyer discards it, more often than not, the rug just changes owners or is donated. The resulting CO2 impact over the product life will be much less for handmade rugs.
For example, the CO2 impact spread over product life of a cotton machine-made rug is 2.73 kg CO2e each year, however the same figure is 0.6 kg CO2e each year for a cotton handmade rug used for 15 years.
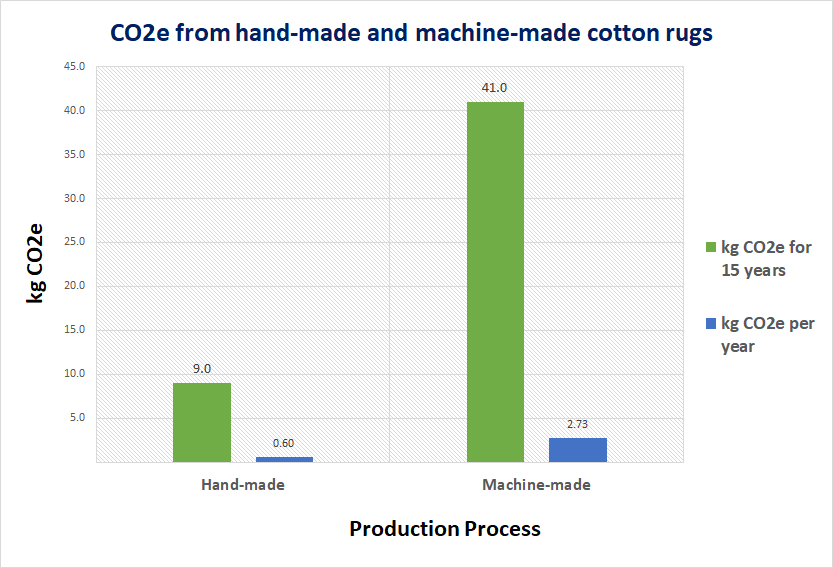
*Since a machine-made rug has a lifespan of 3 years, we have considered 5 such rugs to have been used during the period of 15 years.
Thus, when you choose handmade products, you’re on the path to a more sustainable space.
You are choosing to reduce the carbon footprint of your space and help improve the health of the planet, whilst also helping global artisans and thus reducing poverty.
Conclusion
This is how you should calculate the carbon footprint of the items you produce. It is not an easy task; however, it is an important one and it is your responsibility as a business to do so in order to improve your processes and reduce your impact on the environment.
As seen, supplying handmade items is more efficient as it reduces the carbon footprint thus reducing the amount of work you have to put in to improve your business practices and make them more sustainable.
At Rural Handmade, we can help you get access to a sustainable supply chain as we only produce handmade, eco-friendly, sustainable products.
Contact us, to find out more or if you have any questions on calculating your carbon footprint, we are more than happy to help!
PS: Here is the link for the LCA tool for you to calculate the carbon footprint of rugs:
(Please Contact us to let us know if you are experiencing problems with accessing the link or if you have any questions!)
Annexure:
About Rugs- India is one the leading producers of rugs in the world. Various kinds of rugs produced in India are namda (felted rugs), gabba (embroidered rugs), wooden pile rugs, cotton rugs, etc. When compared to rugs and carpets, durries are light, often reversible, and usually made with cotton. Durries have found daily use in rural villages of India. Different parts of India have localized durrie tradition.
References: The model is based on data points from various research papers, as well as primary data from handmade rug producers in Agra, India (one of the centres of the handicraft). The research reports referred to for this model were:
Recommended