Worksheet For Calculating Carbon Footprint For Handicraft Furniture (Carbon Footprint Calculator Attached for you!)
Sep 17, 2021 | Shashwat Vyas


 It is increasingly becoming important for businesses to show how their production is affecting the environment as consumers are becoming increasingly conscious about where they buy from. Here we will show you how to calculate carbon footprint for furniture by giving you also an example and an excel sheet to calculate carbon footprint for your own items!
 Furniture products are widely used in our daily life. In 2020, the world furniture market was worth US$ 509.8 billion.
However, there are growing concerns about its impact on the environment. The environmental impacts occur throughout the life cycle of a product which include: The extraction of natural resources and raw materials; the production process; the use and reuse of products and finally the disposal stage.
To create a sustainable industry and product, the use of renewable natural resources must be combined with a large reduction in environmental impacts such as greenhouse gases.
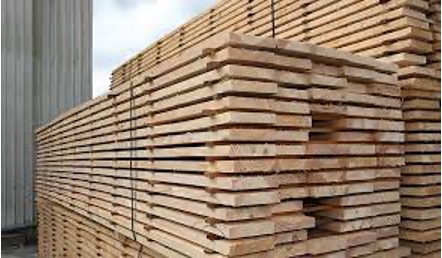
Wood is a renewable building material that has proven to be “environmentally friendly” compared with alternative materials such as steel and plastic. Allthough it is renewable, the use of wood as an input material still contributes as the industries produce waste in the form of small pieces of wood, sawdust and wood chips.
Life cycle assessment (LCA) is a method for evaluating the environmental impacts of products.
The production process uses electrical machinery and Life Cycle Assessment (LCA) takes into account coal burning that occurs to produce electricity as CO2 production has an impact on climate change.
The use of chemical materials for the finishing process also contributes to human pollution.
The Life Cycle Assessment (LCA) tool attached below uses the “cradle to grave” methodology to calculate the carbon footprint of every wooden item of household furniture.
Carbon footprint is the total greenhouse gas (GHG) emissions caused by an individual, event, organization, service, place or product that could be expressed as a carbon dioxide equivalent.
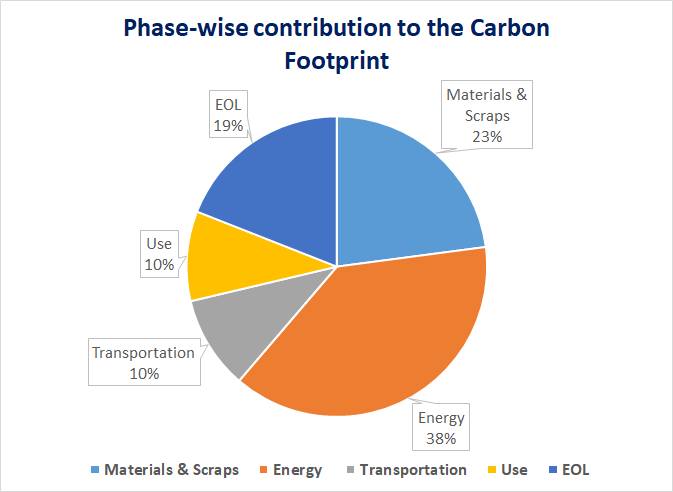
For this purpose, the product’s life cycle was divided into Materials & Scrap, Manufacturing, Transportation, Consumer Use and End of Life phases.
Recent studies of LCA on wood focused mainly on investigating the Life Cycle Information (LCI) of composite materials, and a few of them pay attention to final wood products.
As a business, it is important for you to calculate the carbon footprint of the products you make.
Here we will post an LCA model for a wooden chair to demonstrate how you can calculate this for your own products. For this purpose, the chair’s life cycle was divided into Materials & Scrap, Manufacturing, Transportation, Consumer Use and End of Life phases.
Over 70% of furniture made in India is made from teak, thus we shall be focusing on teakwood furniture in this model.
Let’s start according to the life cycle stage order:
Life Cycle Inventory:
Materials & Scrap Phase: It involves production and extraction of raw materials, including waste
The different materials used during the lifetime of a wooden chair are:
Wooden planks - carved into suitable pieces which are then joined to make the product
Chemicals, like Borax - to treat the wood, reduce its moisture content and protects wood against fungi
Adhesives, like Urea Formaldehyde - for joining pieces of wood together to make the product
Paint/Varnish - final touch to the chair to improve its overall aesthetics
Cardboard Packaging - protecting the item during transportation
The CO2 emissions from each of the above are given in the table below:
The CO2 emissions from wooden planks have 3 dimensions:
Harvesting wood:
It involves all the emissions involved in the establishment & management of a teak plantation; growth of the trees; and their felling and chipping.
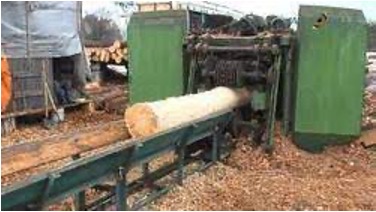
Cutting logs into planks:
Emissions from producing the electricity required for operation. Here are various machines:
Overheads:
These are the emissions from operations of various factory overheads, which though make up a very small part, do contribute towards the total CO2 emissions:
2. Manufacturing Phase: Manufacturing processes that occur, which may include seasoning, carving, assembly, etc.
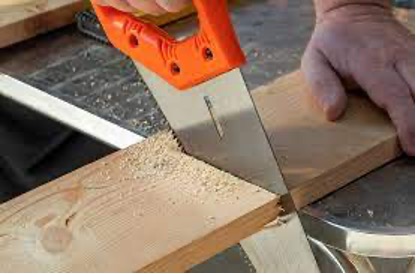
Firstly, the wood is chemically treated (uchemicals like borax) to make it resistant to fungi and fire. The process takes about 7-10 days. Then the planks are put in seasoning kilns for about 12-15 days to greatly reduce its moisture content and improve its strength and stability. Afterwards, craftspersons manually saw the wood into desired shapes, and thickening is done using a hand planer to ensure a uniform surface.
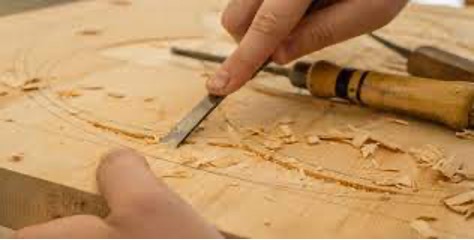
Then, the wooden pieces are skillfully carved using a chisel and hammer. In Edge preparation, pieces of wood are joined together using adhesives. Mechanical pressure using clamps is applied during drying of the glue. Planing is carried out to ensure smoothness of edges. Afterwards a manual handsaw is used to cut shapes for the furniture which are then assembled using glue.

Finally, the surface is manually sanded to smoothen it, to which varnish/paints are applied improving the aesthetics of the product.
The following table provides a summary of CO2 emissions from each of the processes discussed above:
3. Transportation Phase: It comprises of raw material transportation, product transportation and distribution thereof
Assuming that the wood is procured from Guntur (one of the largest timber producing districts in India) the Transport phase can be further divided into the following stages:
Forest to Factory [F2F] - within Nilambur
Factory to Craftsmen [F2C] - Nilambur to Guntur
Craftsmen to Seaport [C2S] - Guntur to Mumbai
Seaport to Overseas Warehouse [S2OW] - Mumbai to London/New York/Los Angeles
Warehouse to Customers [W2C] - Common dist. for all locations
Here are the distance (in kilometers) between each stage:
4. Consumer Use: Customer care of the product over its lifetime
For wooden furniture this has been taken as a regular painting of the chair after every 5 years.
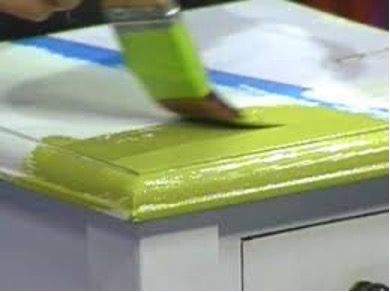
Considering the lifetime of a handmade wooden chair as 30 years, we calculate the number of times it is painted. Putting it together with the weight paint applied each time (assumed to be 0.15 kg) and the carbon intensity of the paint, we get the CO2 emission from the Consumer Use phase of the product.
The life of a handmade wooden furniture can span multiple decades! This is due to the intricacy and durability of the product. Additionally, because it is handmade, people attach a sense of value and admiration to the product, this allows customers to value the products more, which in turn means that they tend to take better care of the product for longer periods of time Furthermore, such furniture finds many secondhand buyers, which themselves keep it in use for great lengths of time and ultimately in the end they're donated to a charitable organisation. Due to this large lifetime of the item, multiple purchases of the same product over time are not made. Hence, handmade wooden furniture becomes a more environmentally friendly item as compared to machine made counterparts.
The CO2 emissions of a handmade wooden chair is just 0.9 kg CO2e/year spread over its lifetime of 30 years.
5. End of Life: Final disposal of products after use
Appropriate End of Life assumptions have been taken, keeping in mind the value/uses of wood. The End-of-Life CO2 emissions are summarised in the following table:
The model illustrates that the global warming impact of handmade wooden furniture is driven mainly by Energy and Materials & Scrap phases, which contribute 38% and 23% respectively.
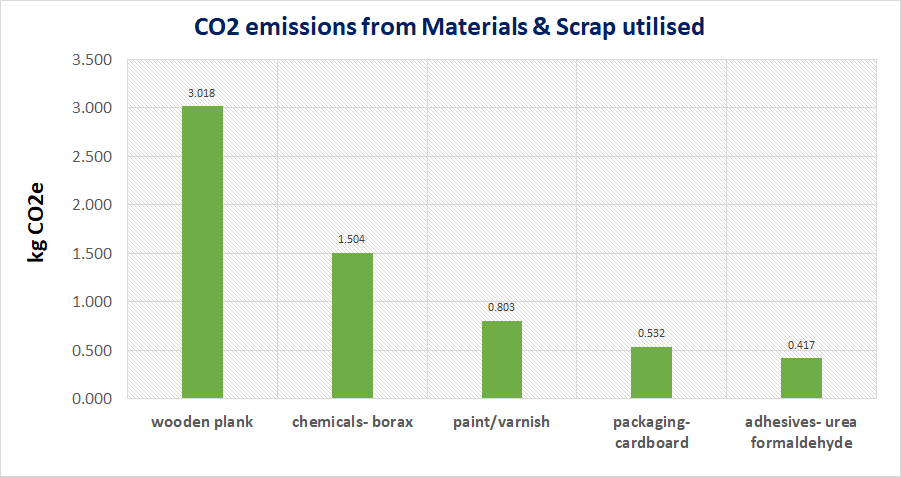
The below chart presents the individual contribution (to the total CO2e) of each material utilised in making the handmade wooden chair.
Conclusion
Overall, this is how the carbon footprint of a wooden chair is calculated. You can use this to calculate the carbon footprint for handicraft furniture that you produce.
Here, we can also see that supplying handmade furniture is more environmentally friendly than supplying ones that are machine made. This means that handmade furniture produces less CO2 emissions and is therefore the best alternative.
Here at Rural Handmade, we can help you with this by providing you with a sustainable supply chain and supplying you with handmade furniture.
Contact us here for more!
PS: Here is the link for the LCA tool for you to calculate the carbon footprint of every wooden item of household furniture that you sell:
(Please Contact us to let us know if there are issues with the link or if you have any questions!)
Annexure:
The model is based on data points from various research papers, as well as primary data from handmade rug producers in Agra, India (one of the centres of the handicraft). The sources referred to for this model were:
Recommended