Pricing Inventory And Sales Analysis Report For Businesses
Oct 12, 2023 | Ananya Ballari


 The Pricing and Inventory Analysis Report is a detailed document that provides valuable information to businesses. It gives them insights into their sales, inventory, prices, and a look at what their competitors are charging for similar products.
Our Pricing and Inventory Analysis Report is your helpful partner, showing you the ropes on sales, stock, pricing, and what your competitors are up to. It's like a handy toolkit for your business, helping you set the right prices, manage your stock, and come up with strategies that work.
Stick till the end of the blog to get the link to the report that you can use for your business!!
The Pricing and Inventory Analysis Report is a detailed document that provides valuable information to businesses. It gives them insights into their sales, inventory, prices, and a look at what their competitors are charging for similar products.
Our Pricing and Inventory Analysis Report is your helpful partner, showing you the ropes on sales, stock, pricing, and what your competitors are up to. It's like a handy toolkit for your business, helping you set the right prices, manage your stock, and come up with strategies that work.
Stick till the end of the blog to get the link to the report that you can use for your business!!
Let’s delve into the report and understand how to use & interpret it to benefit your business.
Benefits of using the Pricing and Inventory Analysis Report/model
1. Data-Driven Decision-Making: The report serves as a data-driven compass for your businesses. It offers insights that help you make informed decisions about crucial aspects of your operations, such as pricing, inventory management, and marketing strategies.
2. Enhanced Profitability: Through the analysis of sales data and competitor pricing, you can fine-tune your pricing strategies. This optimization enables you to strike the right balance between attracting customers and maximizing your profits, ultimately boosting your bottom line.
3. Efficient Resource Utilisation: By having a clear picture of your inventory levels and sales trends, you can allocate your resources more efficiently. This includes managing your stock to prevent overstocking or running out of popular items.
4. Adaptation to Market Changes: Regularly analyzing market trends and competitor pricing allows you to be agile and responsive. You can adapt your strategies quickly in response to changing market conditions, ensuring you stay ahead of the competition and remain relevant to your target audience.
Sales Report:
A Sales Report provides a detailed overview of your product sales and helps you understand how your products are performing in the market.
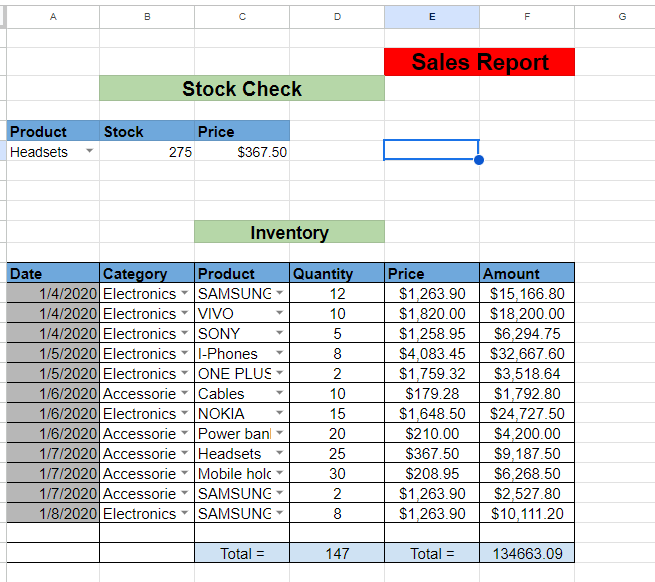
The above sales report depicts the sales of various products. The Stock check shows the net stock of each product after. You just have to select a product from the dropdown list to see the inventory of that particular product.
This information can be used to generate a variety of insights, such as:
Top-selling products or services: You can identify the top-selling product and this information can be used to focus sales and marketing efforts on the most popular products or services.
Lowest-selling products or services: You can identify the lowest-selling products and this information can be used to identify products or services that are not selling well and to make decisions about whether to discontinue them or to make changes to the sales strategy.
Highest revenue-generating product: By looking at the amount and price column we can identify the highest revenue-generating product and make strategies to improve the sales of that product to increase your revenue.
Sales trends over time: Sales trends over time can be identified by looking at the date column and the quantity and amount columns. This information can be used to identify seasonal trends, as well as any longer-term trends in the business.
Here's how it can benefit your business:
1. Sales Performance Analysis: The Sales Report lists your products, their current stock levels, and prices. This information helps you track the performance of each product, identifying which ones are selling well and which may need attention.
2. Inventory Management: The report also shows when products were sold, allowing you to manage your inventory efficiently. For instance, you can see if certain products are selling quickly or slowly, helping you adjust your stock levels accordingly.
3. Spotting Trends: By analyzing sales data, you can spot trends in demand for various products of your business. This information is valuable for planning marketing campaigns and adjusting product offerings to align with customer demand.
Net Stock Report:
The Net Stock Report provides a snapshot of your available stock after sales. It shows how many of each product are left in inventory, considering what has been sold.
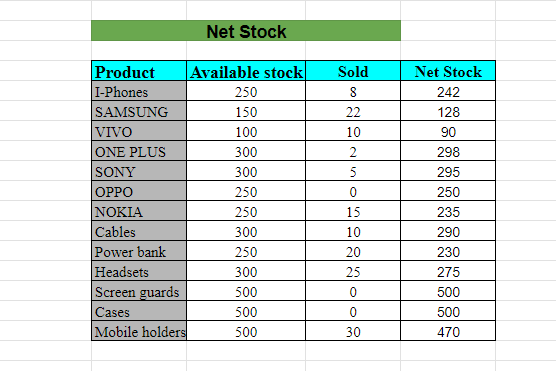
The net stock report shows the available stock with the business after sales. This can be used to track inventory levels, identify trends, make informed decisions, and forecast demand.
Track inventory levels: It can be used to track inventory levels over time. This information can be used to ensure that the business has enough stock on hand to meet demand, while also avoiding overstocking and the associated costs.
Identify trends: It also be used to identify trends in sales and inventory. For example, a business may notice that a certain product is selling quickly, while another product is not selling well. This information can be used to make informed decisions about pricing, marketing, and product development.
Forecasting demand: A business can forecast the demand for its products with the help of net stock data. The product with high sales and less net stock may indicate that the demand for that product is high and vice versa and this will be helpful in - making stock purchase decisions, pricing strategy, and marketing strategy.
Here's how it benefits your business:
1. Inventory Management: It offers a clear view of your current stock levels for each product. This helps you avoid overstocking, which ties up capital and prevents stockouts, which can lead to missed sales opportunities.
2. Identifying Popular Products: By comparing available stock with sales data, you can identify which products are in high demand. This information guides your purchasing and production decisions, ensuring you maintain a sufficient supply of popular items.
3. Optimised Reordering: Knowing your net stock helps you plan when and how much to reorder. You can make reorder decisions based on the net stock, reducing the risk of running out of popular products and streamlining your restocking process.
4. Profitability Assessment: Understanding net stock is essential for assessing the profitability of your inventory. It allows you to evaluate which products are selling well and contributing to your bottom line, as well as which ones may need adjustments.
Price Control Sheet
A price control sheet is a document that allows businesses to track the price of various products, as well as their sales, inventory, and demand. This information can then be used to make informed pricing decisions that can help to increase revenue and profitability.
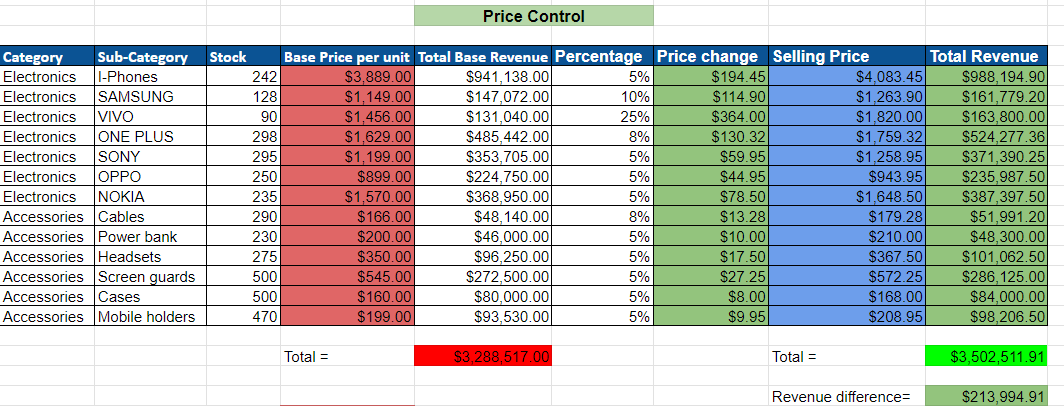


The above price control sheet shows the price change of the various products depending on the net stock, sales, and demand.
The criteria for the percentage of price change is set according to the stock/inventory with the business, meaning the product having lesser inventory has a higher price change and the product having higher inventory has a lesser price change.
The product having lesser stock might indicate more sales which means that the demand for that particular product is high and the business can increase the price by a relatively higher percentage to book more revenue and profit. Similarly, products with higher stock might indicate lesser sales meaning that the product has lesser demand and the business might want to increase the price by a relatively lesser percentage.
The criteria sheet above shows the criteria of price change for each product according to the stock. Products having higher stock/inventory have lesser price change whereas the products having smaller stock/inventory have higher price change.
A business can review its pricing strategies to increase revenue and profits depending on the performance of the products.
Here are some of how a price control sheet can be helpful for business:
Track prices over time: A price control sheet can be used to track the price of various products over time. This is important because it allows businesses to ensure that their prices are competitive and that they are generating a profit.
Boost sales: By using a price control sheet to set prices that are in line with customer demand, businesses can boost sales. Customers are more likely to buy products that are priced appropriately.
Improve profitability: By using a price control sheet to set prices that generate a profit, businesses can improve their profitability. Businesses need to set prices that are high enough to cover their costs and generate a profit.
Identify opportunities for discounts and promotions: By tracking sales and inventory data, businesses can identify opportunities to offer discounts and promotions on products that are not selling well. This can help businesses to clear out inventory and generate revenue.
Competitor Price Analysis:
A Competitor Price Analysis involves comparing the prices of your products with those of your competitors in the market. A business needs to analyze the prices of its competitor’s products to set competitive prices for their product and to make informed pricing decisions
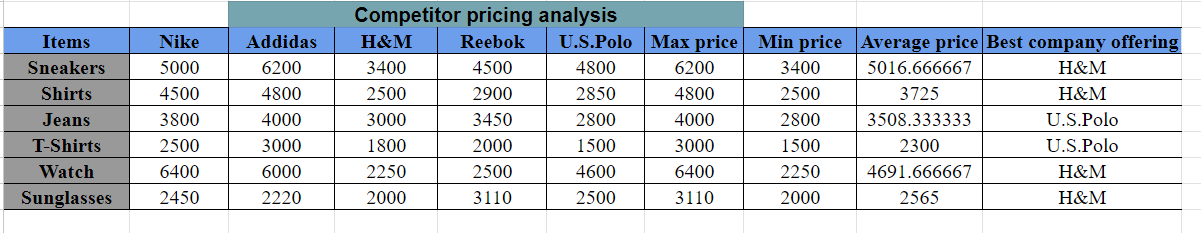
A business can use the competitor pricing analysis sheet to review and alter its pricing strategy:
Identify overpriced products: By comparing your prices to the prices of your competitors, you can identify any products that you are overcharging for. Once you have identified these products, you can lower your prices to become more competitive according to your goals.
Identify underpriced products: You can also use the competitor pricing analysis sheet to identify any products that you are undercharging for. Once you have identified these products, you can raise your prices to increase your profits.
Identify opportunities for price discrimination: You can identify opportunities for price discrimination by analyzing the competitor pricing analysis table to identify different customer segments and their willingness to pay.
Here's how it can benefit your business:
1. Pricing Strategy Refinement: By examining competitor prices, you gain insights into how your products' prices compare to similar offerings in the market. This helps you adjust your pricing strategy to remain competitive. For example, if your prices are significantly higher than your competitors, you may consider lowering them to attract more customers.
2. Competitive Edge: Identifying the best-priced products among your competitors can help you pinpoint areas where you can stand out. If your prices are more attractive for certain products, you can promote them as your "best deals" to draw customers to your business.
3. Market Positioning: Understanding how your prices rank among competitors allows you to position your business effectively. For instance, if you find that your prices are consistently lower, you can position your brand as the most affordable choice in the market. If your prices are higher but justified by superior quality, you can emphasize the value and quality of your products.
4. Pricing Trends: The analysis provides insights into pricing trends within your industry. You can track how competitors adjust their prices over time, which can help you anticipate market shifts and adapt your pricing strategy accordingly.
5. Maximising Profit Margins: While staying competitive is essential, the analysis also helps you identify opportunities to maximize profit margins. For example, if you discover that certain products are consistently priced higher in the market, you can consider increasing your prices for those products while ensuring they still offer value to customers.
In a nutshell, the Pricing and Inventory Analysis Report is a valuable tool for your business. You can derive valuable insights to make informed decisions, boost profitability, and navigate the market effectively. This practical resource can be your guide to improved business outcomes.
Below is the link for this valuable tool that you can access. If you’re questioning how to use it? Well, this blog has explained it all!!
Inventory and Sales Analysis Tool Download sheet
|
Recommended